
4. Calculating and plotting band diagrams
4. Calculating and plotting band diagrams
Execute mpb with your control file, but redirect the output of the program to a file rather than to the terminal window. Redirecting and piping are useful tools at the terminal window. The symbol > redirects the output of a command to a file rather than the terminal window, >> redirects the output to the end of a file, &> redirects the output and any error messages to a file, and | pipes the output of a command into another command. See the following examples:
If you add an ampersand, &, to the end of a command line, then the process will run in the background, leaving a command prompt so that you can do other things in the window while it is running. The downside is that you won’t be notified on the screen when it is done.
If you want to see the calculation’s progress on the screen AND redirect it to a file, then try this:
$mpb Inv_Opal.ctl | tee &> inv_opal.out
Keep in mind though that tee doesn’t work well if there are an extremely large number of k-points being calculated (over 4000 or so) because tee stops redirecting after a few hundred thousand lines of text.
Another way to see the output and redirect to a file is with two lines of code like this:
$mpb Inv_Opal.ctl &> inv_opal.out &
$tail –f inv_opal.out
The tail –f function follows a file, displaying each line as it is added to it. When the calculations are complete, exit the tail function by pressing ctrl+c.
There is an option in mpb that allows the calculation to be broken up into smaller pieces that are calculated simultaneously. The following command splits the list of k-points into 10 parts, executes 10 instances of the mpb program simultaneously, and then recompiles the output of each at the end. The number of instances of the program should not be greater than the number of logical cores the processer running the software has, and it isn’t a bad idea to keep a couple of the cores free so you can work while the calculations are running.
mpb-split 10 inv_opal.ctl &> inv_opal.out
4. Calculating and plotting band diagrams
Execute mpb with your control file, but redirect the output of the program to a file rather than to the terminal window. Redirecting and piping are useful tools at the terminal window. The symbol > redirects the output of a command to a file rather than the terminal window, >> redirects the output to the end of a file, &> redirects the output and any error messages to a file, and | pipes the output of a command into another command. See the following examples:
| $mpb Inv_Opal.ctl |
Sends the output of mpb to the terminal window. |
| mpb Inv_Opal.ctl > inv_opal.out |
The output of mpb is written into, replacing, a file called inv_opal.out. |
| $mpb Inv_Opal.ctl >> inv_opal.out |
The output of mpb is written to the end of a file called inv_opal.out. |
| $mpb Inv_Opal.ctl &> inv_opal.out |
The output of mpb and any error messages is written into a new file called inv_opal.out. |
| $mpb Inv_Opal.ctl | grep freqs |
The output of mpb is piped into a command called grep, which will find all the lines of output beginning with the word “freqs” and send them to the terminal window. |
| $mpb Inv_Opal.ctl | grep freqs &> f.out | All the lines of output starting with the word “freqs” and any error messages, will be written into a file called f.out. |
If you add an ampersand, &, to the end of a command line, then the process will run in the background, leaving a command prompt so that you can do other things in the window while it is running. The downside is that you won’t be notified on the screen when it is done.
If you want to see the calculation’s progress on the screen AND redirect it to a file, then try this:
$mpb Inv_Opal.ctl | tee &> inv_opal.out
Keep in mind though that tee doesn’t work well if there are an extremely large number of k-points being calculated (over 4000 or so) because tee stops redirecting after a few hundred thousand lines of text.
Another way to see the output and redirect to a file is with two lines of code like this:
$mpb Inv_Opal.ctl &> inv_opal.out &
$tail –f inv_opal.out
The tail –f function follows a file, displaying each line as it is added to it. When the calculations are complete, exit the tail function by pressing ctrl+c.
There is an option in mpb that allows the calculation to be broken up into smaller pieces that are calculated simultaneously. The following command splits the list of k-points into 10 parts, executes 10 instances of the mpb program simultaneously, and then recompiles the output of each at the end. The number of instances of the program should not be greater than the number of logical cores the processer running the software has, and it isn’t a bad idea to keep a couple of the cores free so you can work while the calculations are running.
mpb-split 10 inv_opal.ctl &> inv_opal.out
 |
| Commands used to execute calculation of the inverse opal example and sort out the frequency data from the output. The last command, tail, simply displays the last 10 lines of the output so that we can see that it was sorted correctly. |
Run mpb-split and redirect the output to a file (inv_opal.out)
using &>. When the calculation is
complete, sort all of the lines of output from the file that contain the
optical mode frequencies of each k-point using grep, and redirect the output to
a new file (inv_opal.freqs). The
frequency file will be a comma delimited list of k-points and frequencies.
Open Excel, and then open the inv_opal.freqs file. The Import Wizard opens up and asks how you want the file to be delimited, select “comma delimited.”
 |
| Excel can separate the output into easily graphable columns for you, after trying to open the text file the import wizard should pop up. First choose delimited. |
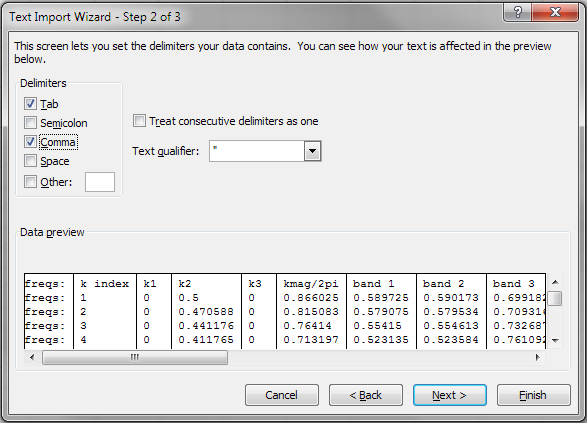 |
| Make sure that "Comma" is selected as the delimiter. |
 |
| Origin will plot all the bands together nicely. Take care to label the x-axis appropriately according to the order of the k-points used in your control file. |
No comments:
Post a Comment